Real chart snapshots with Elliott Wave markup. We publish free analysis regularly so you can see our methodology in action.
Each free chart is a dated snapshot of a full Elliott Wave count: wave labels, Fibonacci levels and the invalidation line, exactly as our members receive them.
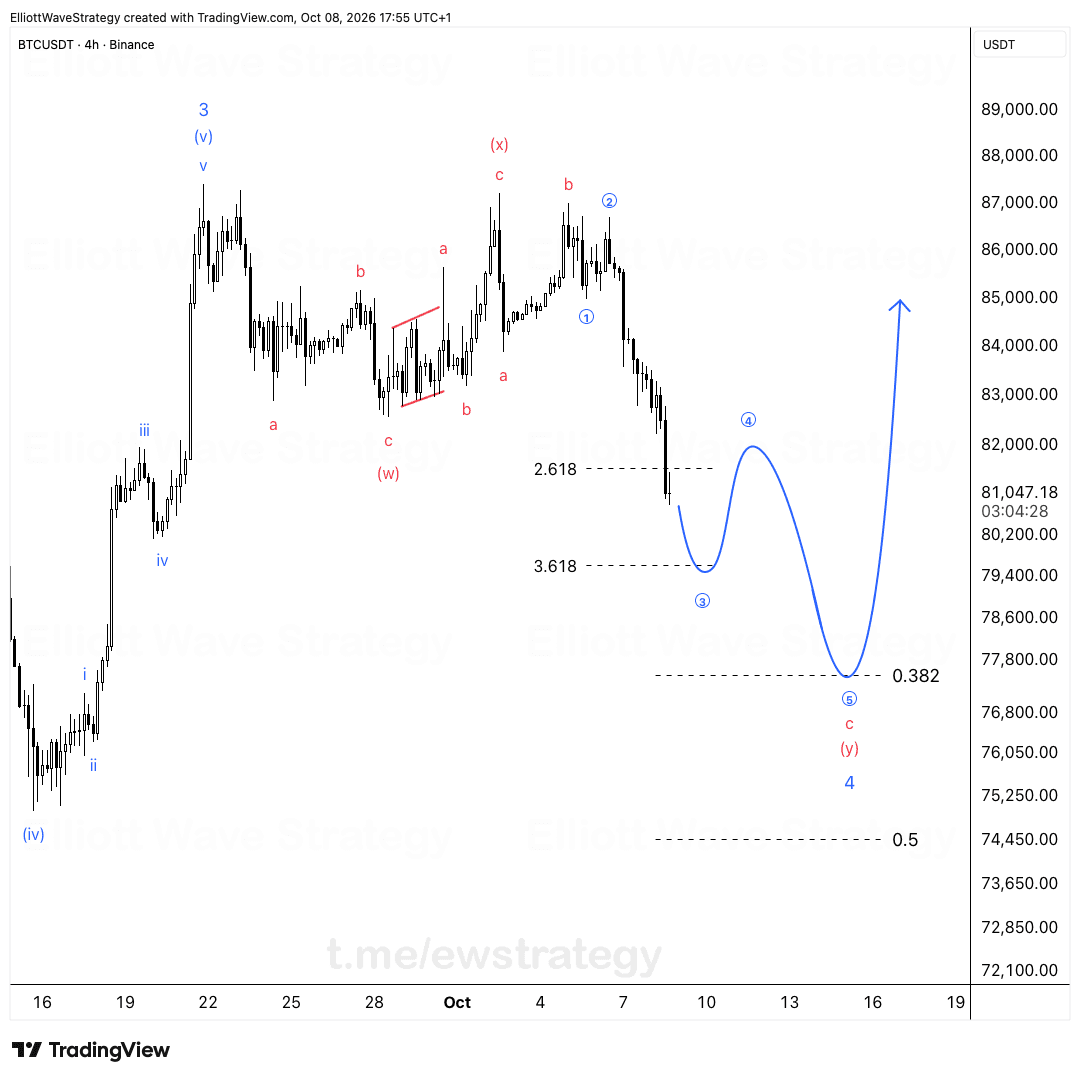
Wave 4 is dragging this out longer than I'd like. The (w) and (x) are done, and this drop is the c of (y). Price already cut through the 2.618 at 81,700.
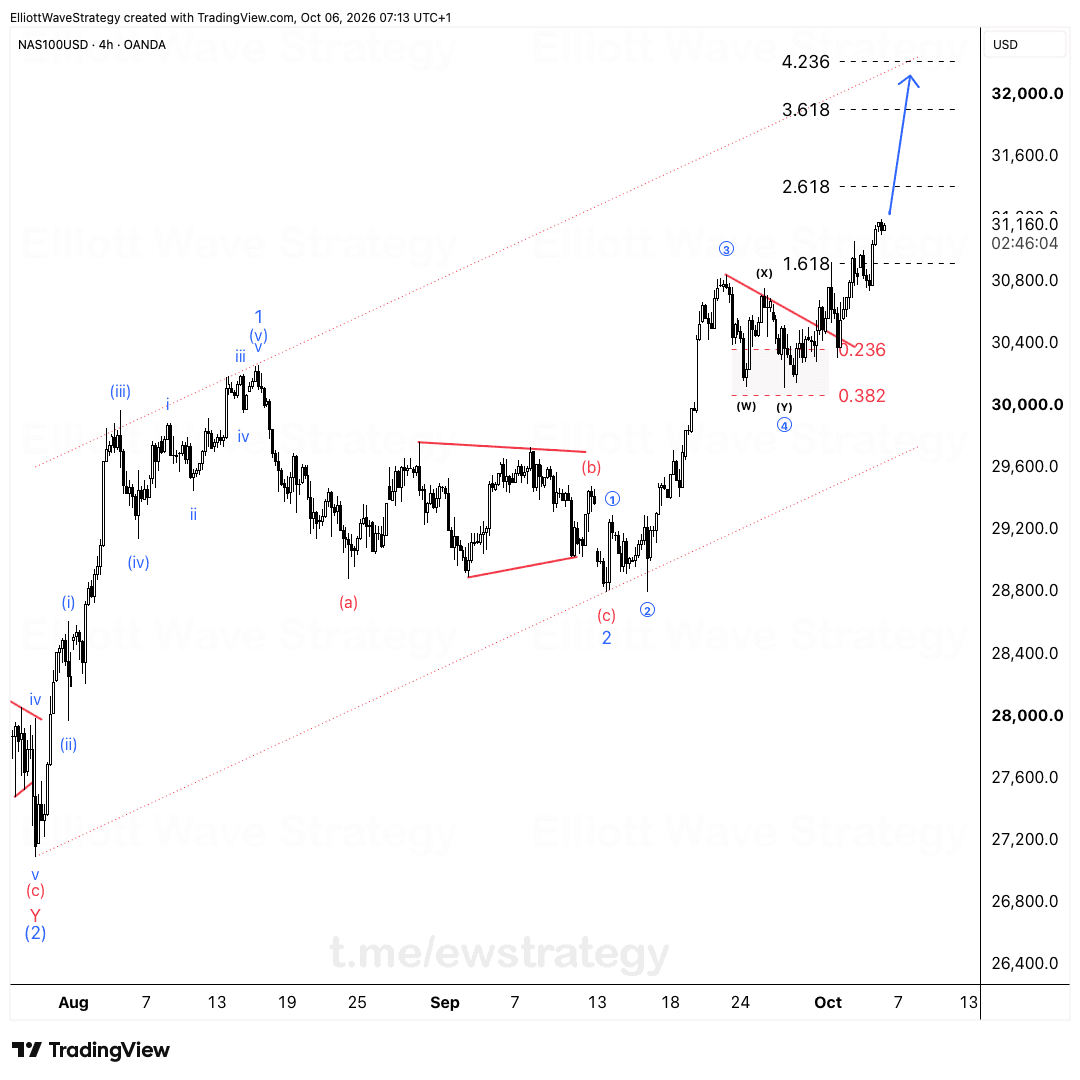
We've followed this move from the start. Price pulled back into our marked area, broke the trendline, and wave (4) held between the 0.236 an...
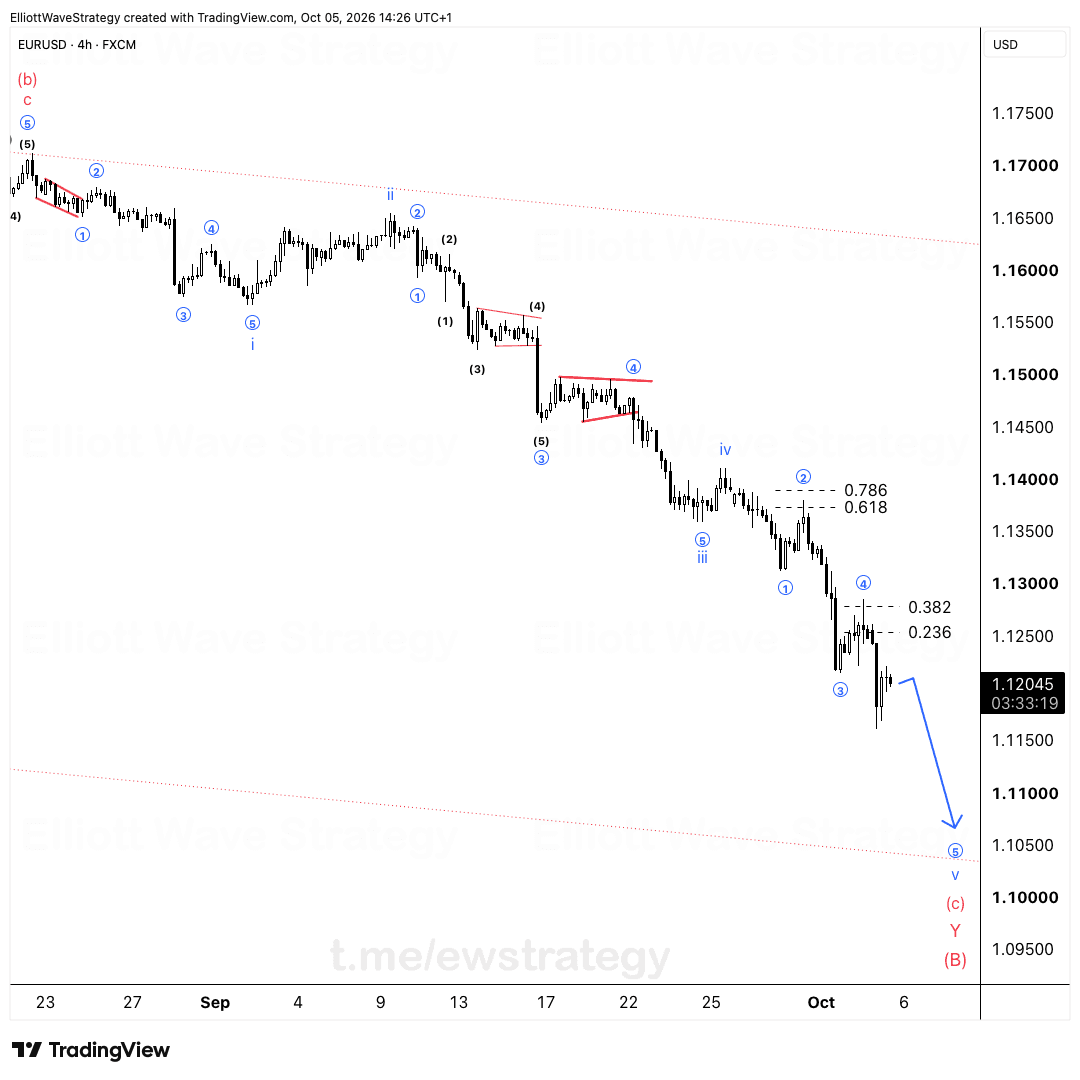
Following up on last week. From the August high, i, ii, iii and iv are done. v is still running, and inside it we're in ④ with ⑤ still to co...
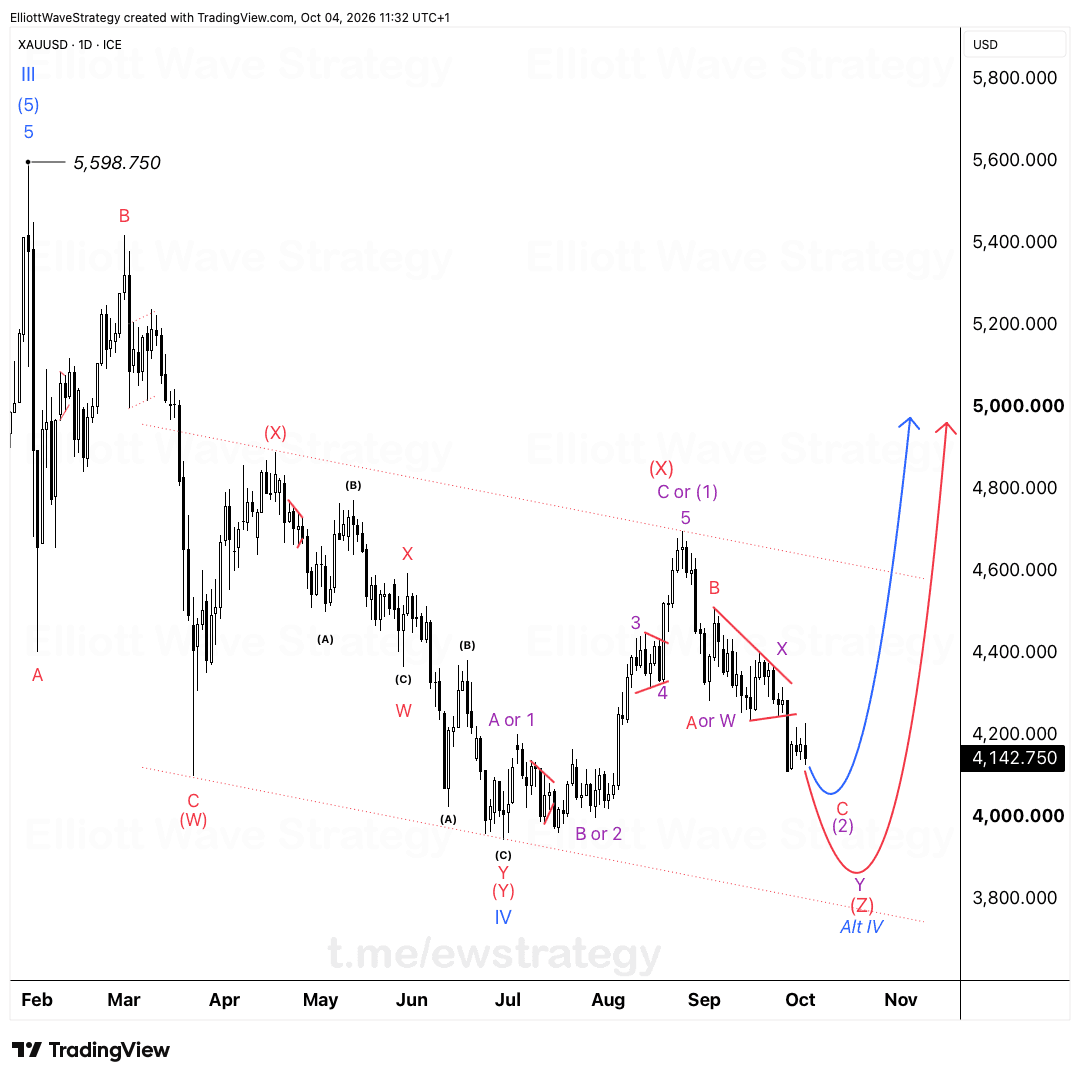
Everyone keeps telling me gold is going higher. Keep calling the bottom and you'll have something to celebrate when it finally rallies. Conv...
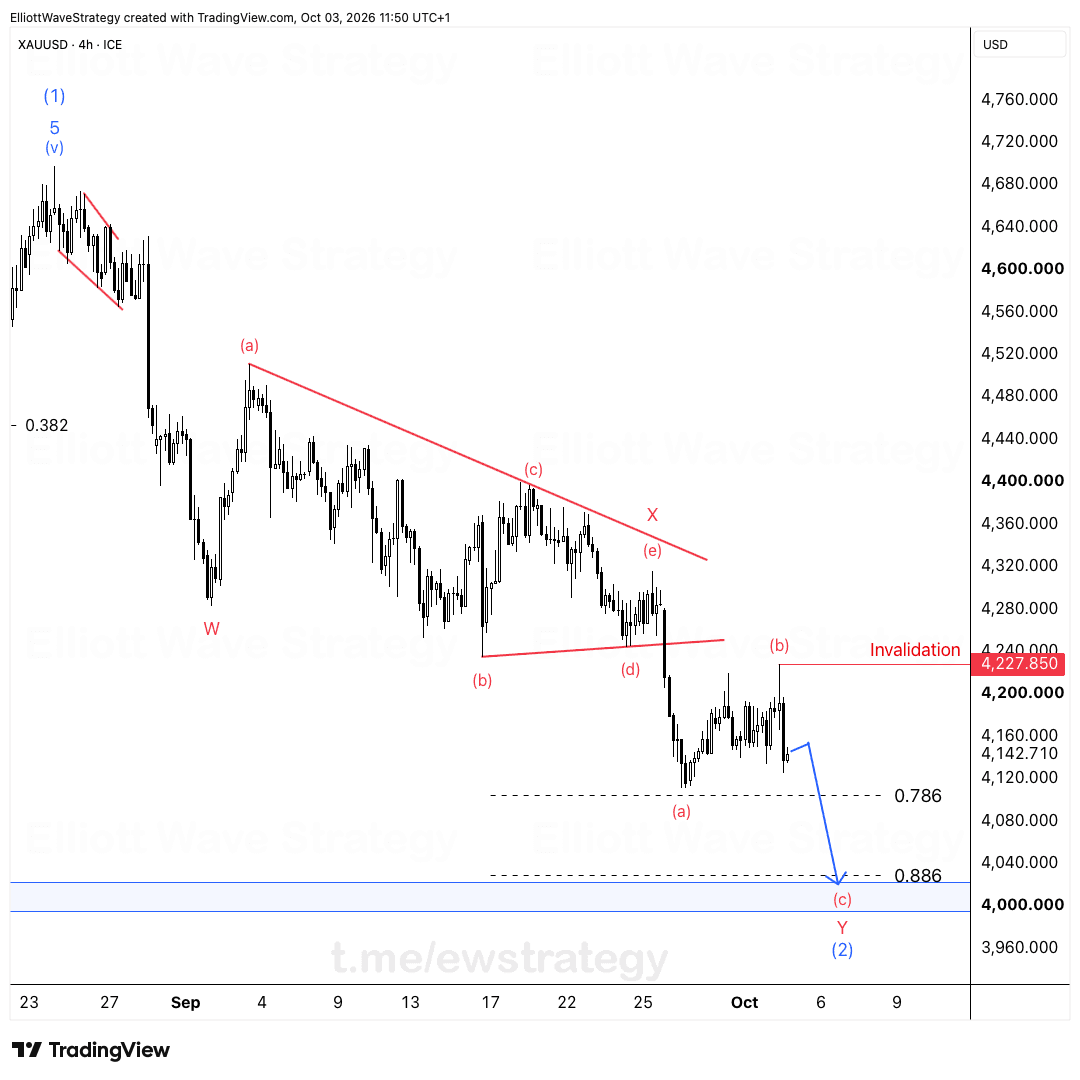
Gold bounced into 4,228 on Friday and turned back down. That level is the invalidation on both of my counts, so the rejection matters.
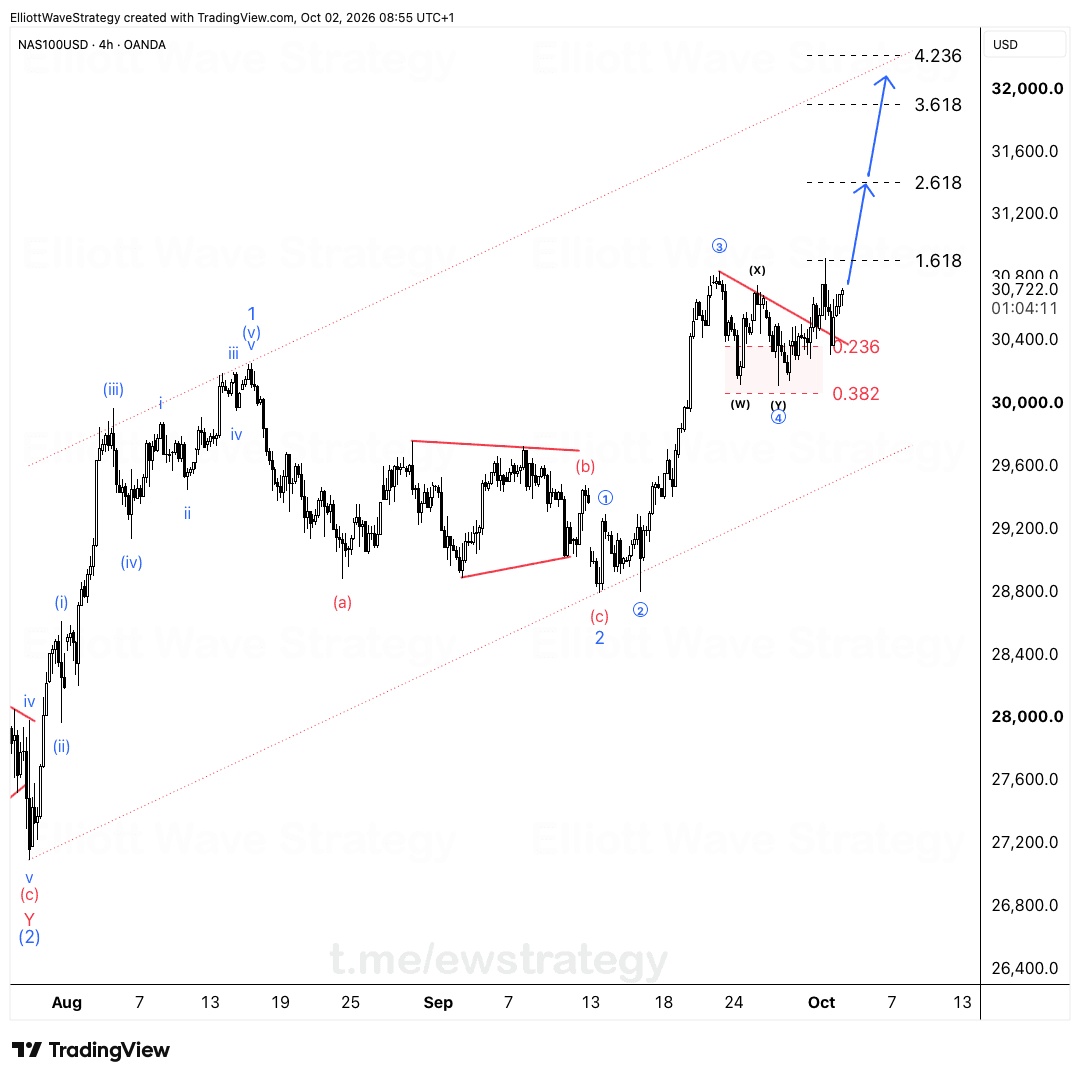
The correction took longer than I expected after our last update, but Nasdaq has now broken above the falling trendline. I think wave ④ is d...
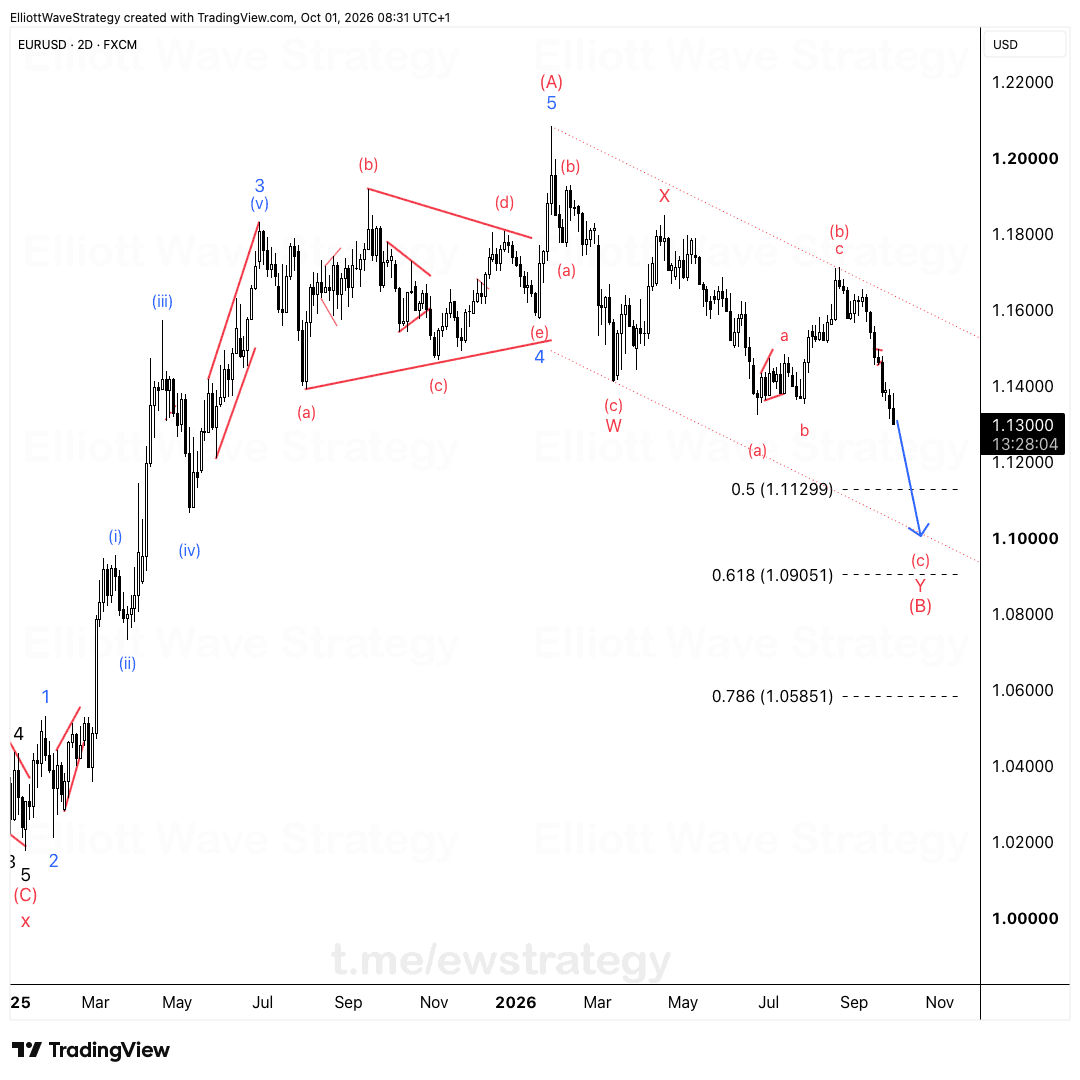
The dollar upside alternative we talked about fits what I'm seeing on EURUSD too. I still think the W-X-Y correction has more room to run. W...
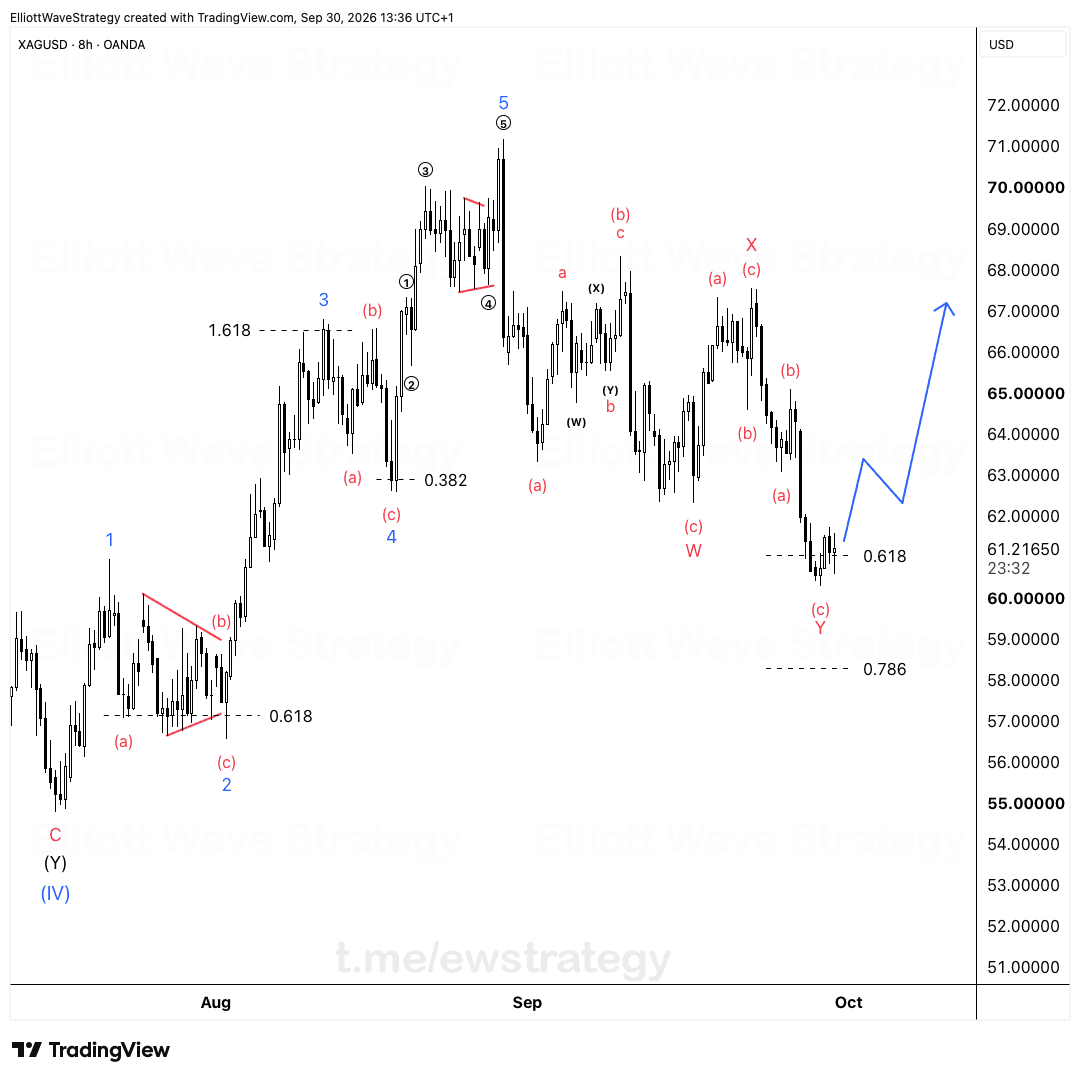
Silver pulled back to the 0.618 retracement, around 61.2 on the 8h chart. The correction from the wave 5 high is a W-X-Y, and wave (c) of Y...
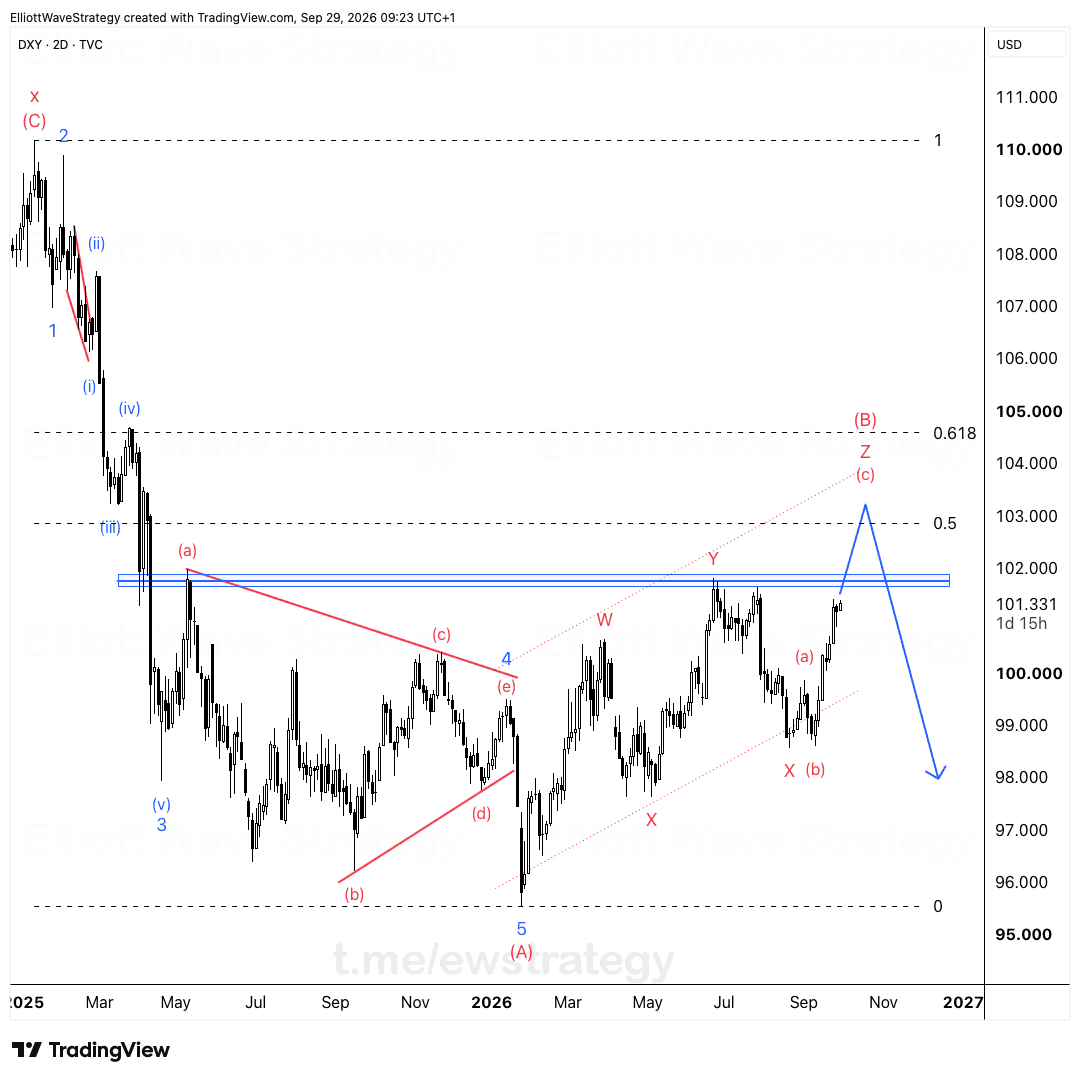
I still expect the dollar to turn lower, but the confirmation hasn't shown up yet. Price is pushing into the marked resistance zone, so I'm...
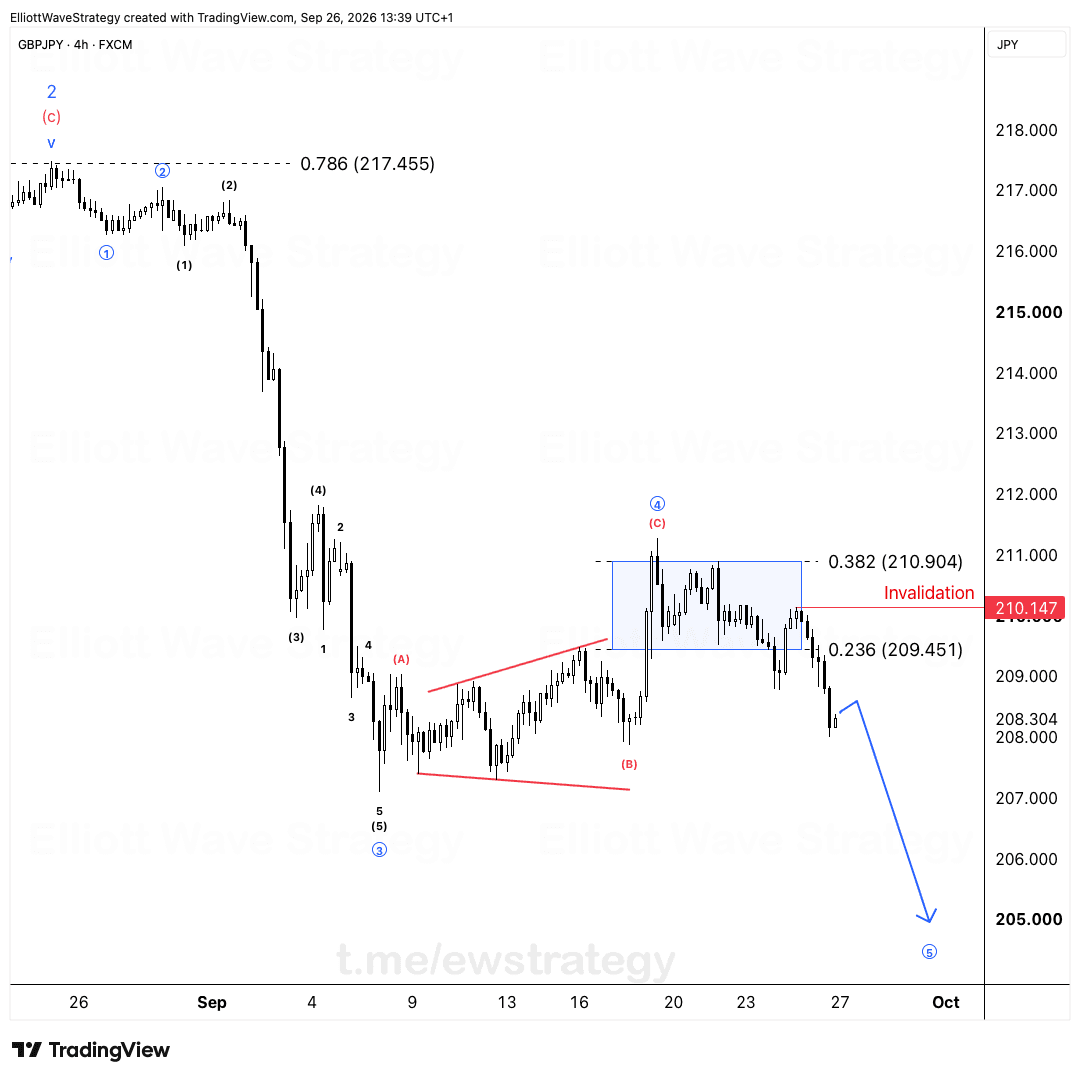
That correction took its time. Friday finally got things moving again.
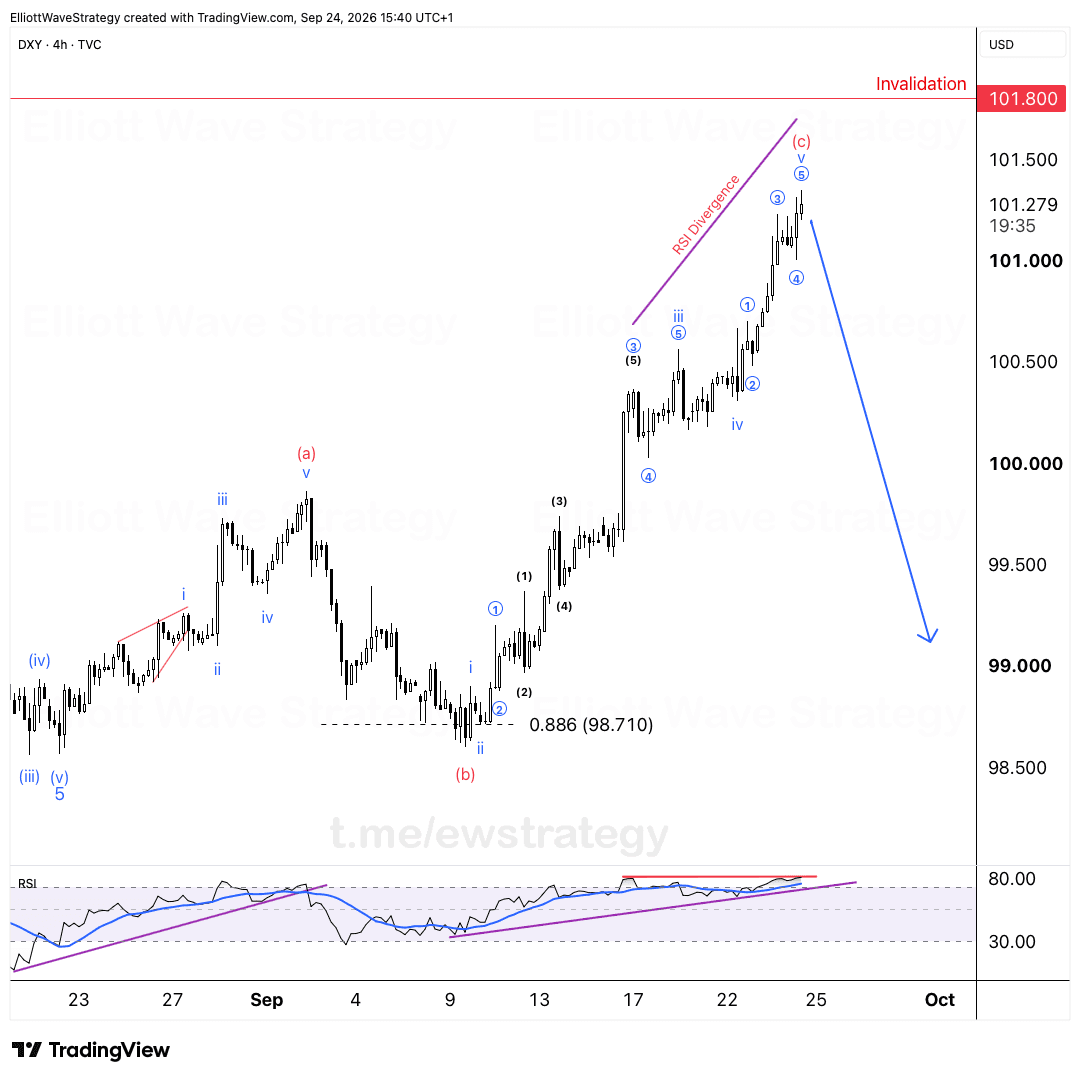
Not much to fix here, honestly, this one already sounds like a trader wrote it. Just a couple tweaks:
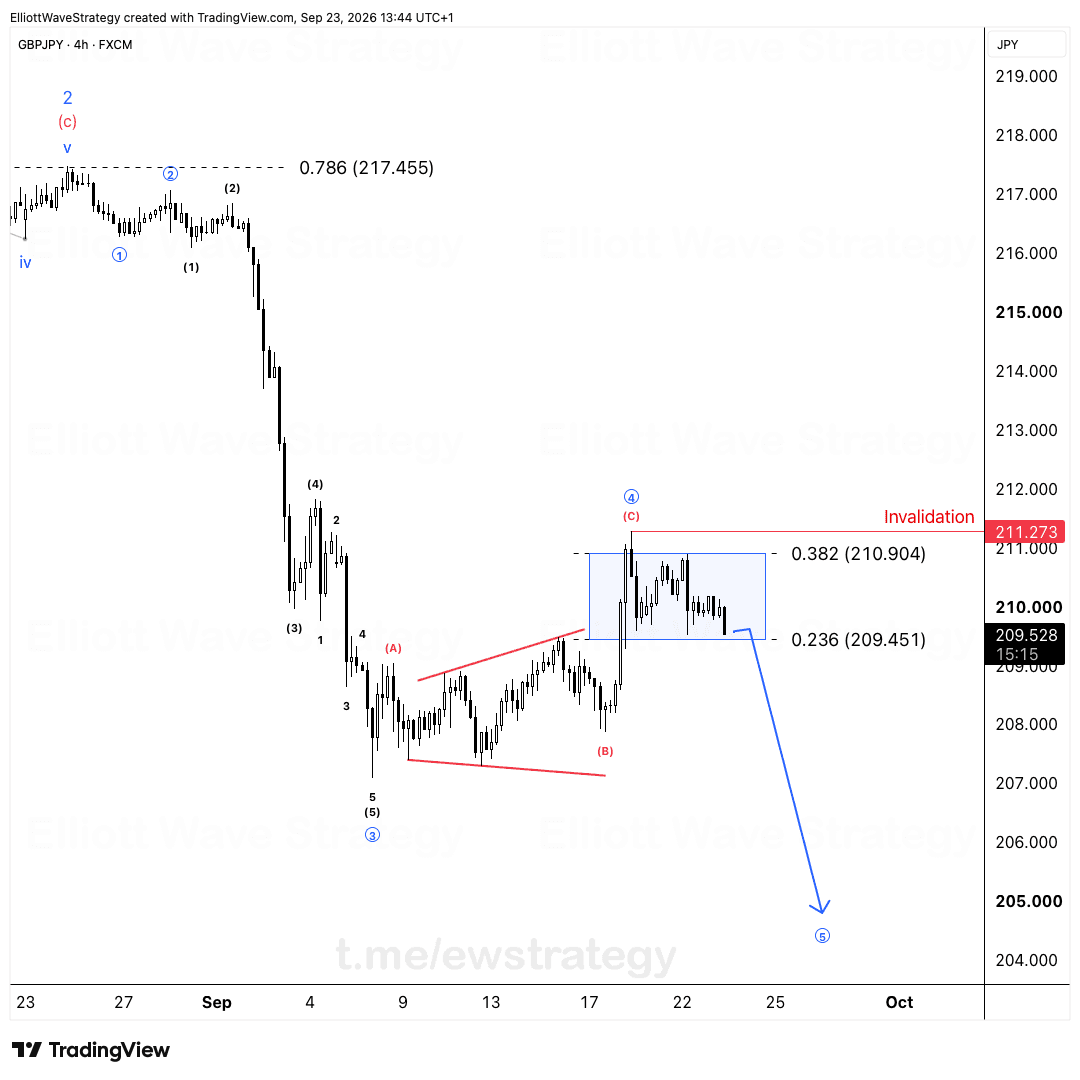
GBPJPY 🇬🇧🇯🇵 (https://s3.tradingview.com/snapshots/g/G4QHUIW7.png)
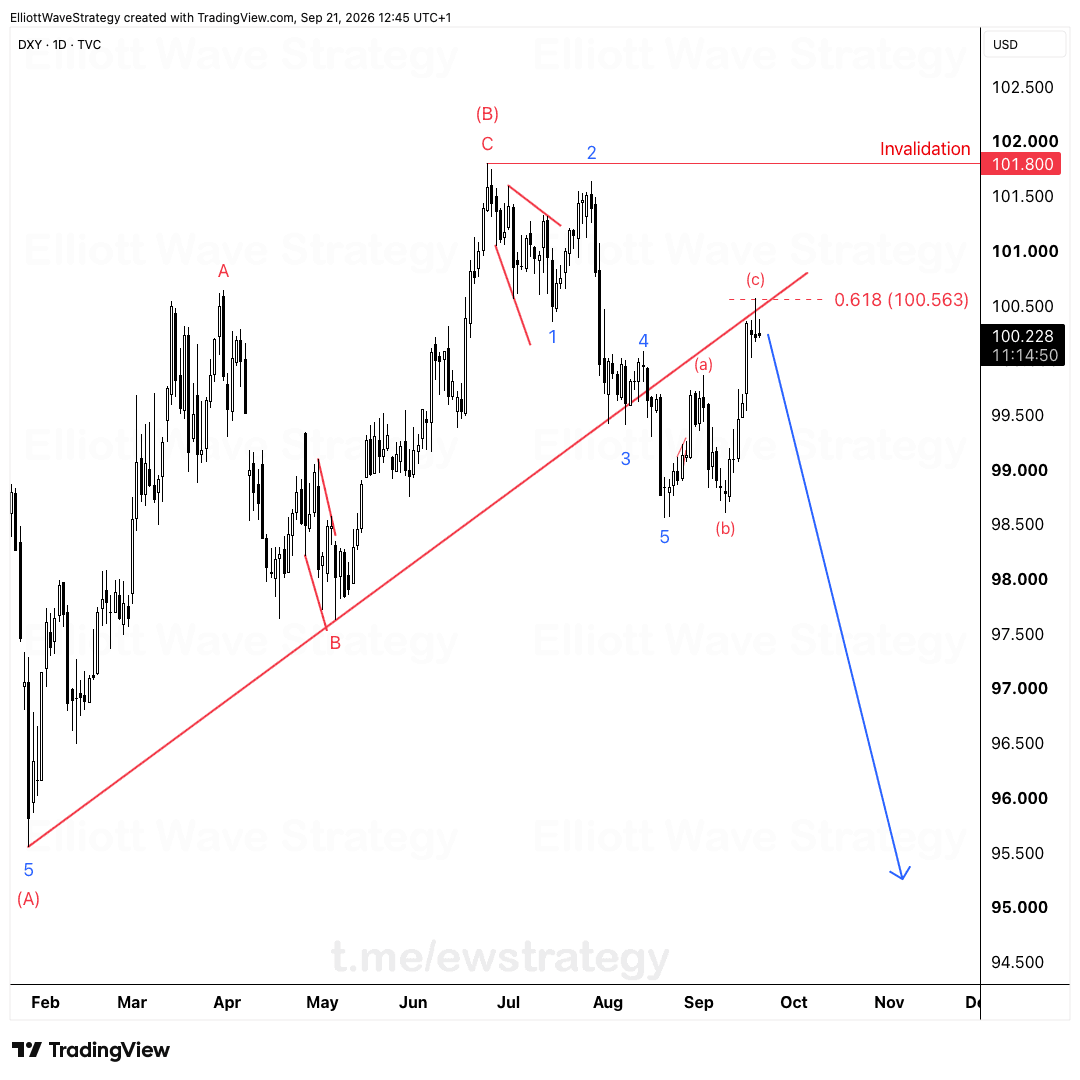
The rally into 100.563 is exactly what we were waiting for. Price tagged the 0.618 retracement right back under the broken trendline. Precis...
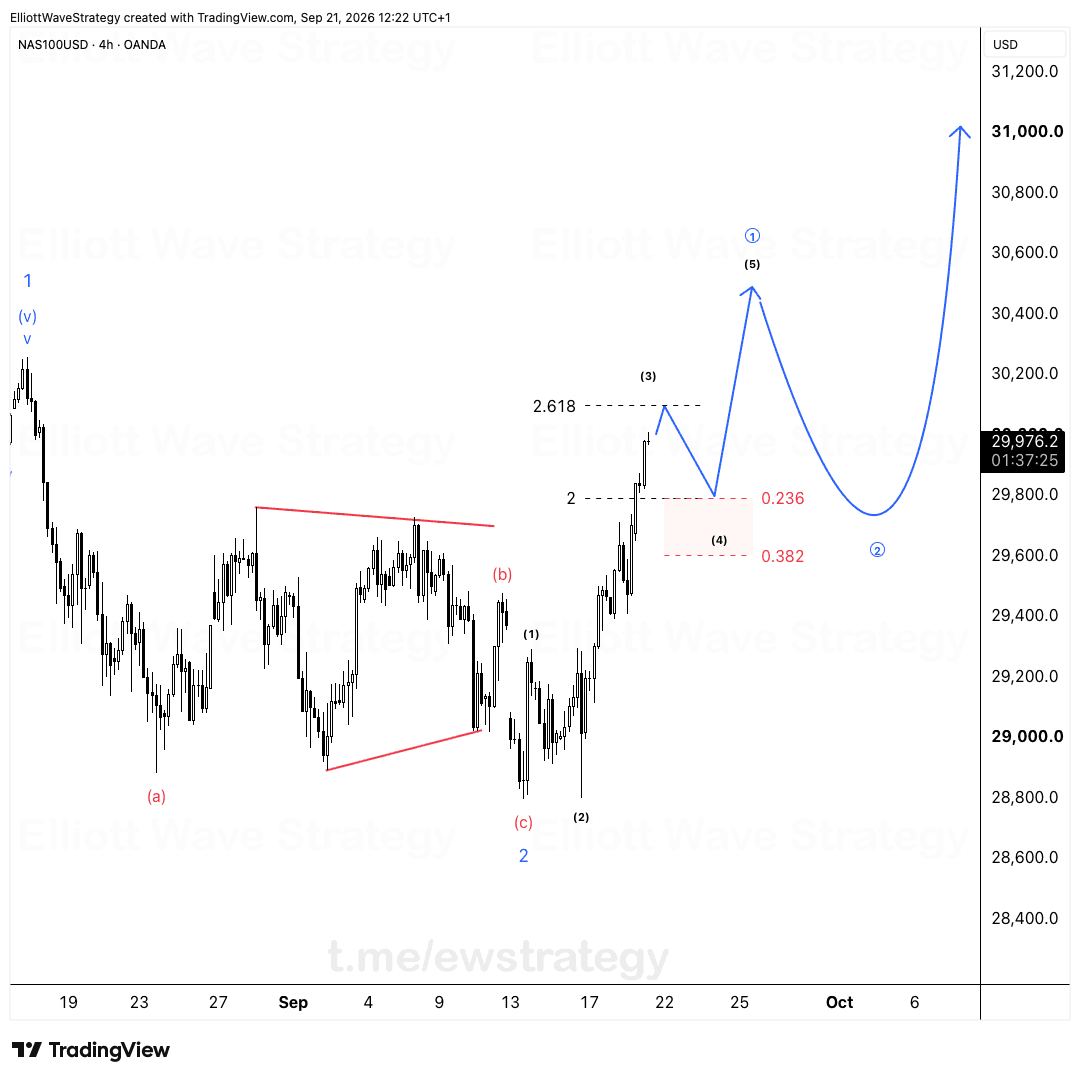
Nasdaq is moving higher, exactly the direction we called out on Friday.
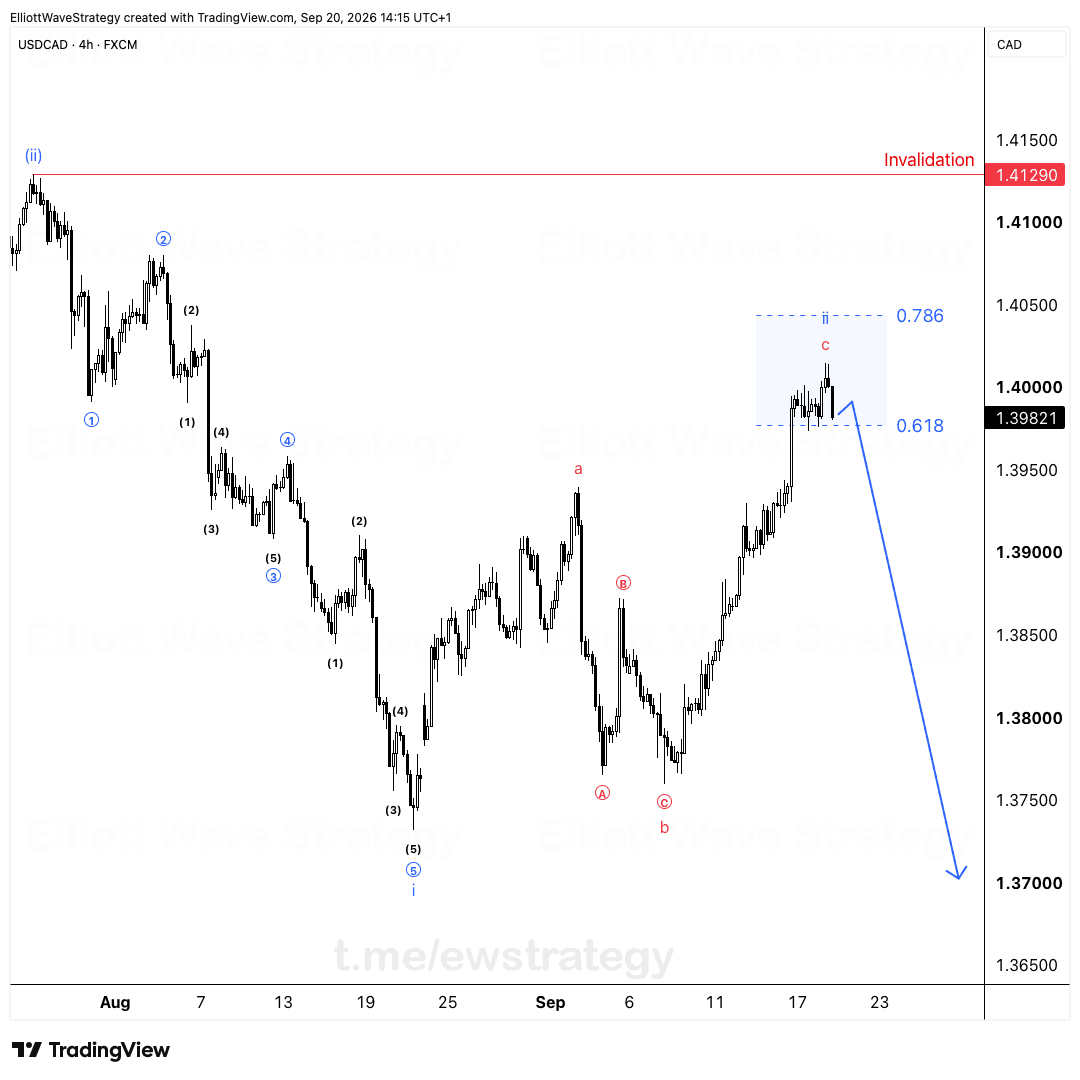
USDCAD 🇺🇸🇨🇦 - (https://s3.tradingview.com/snapshots/o/oZmvtvFR.png)
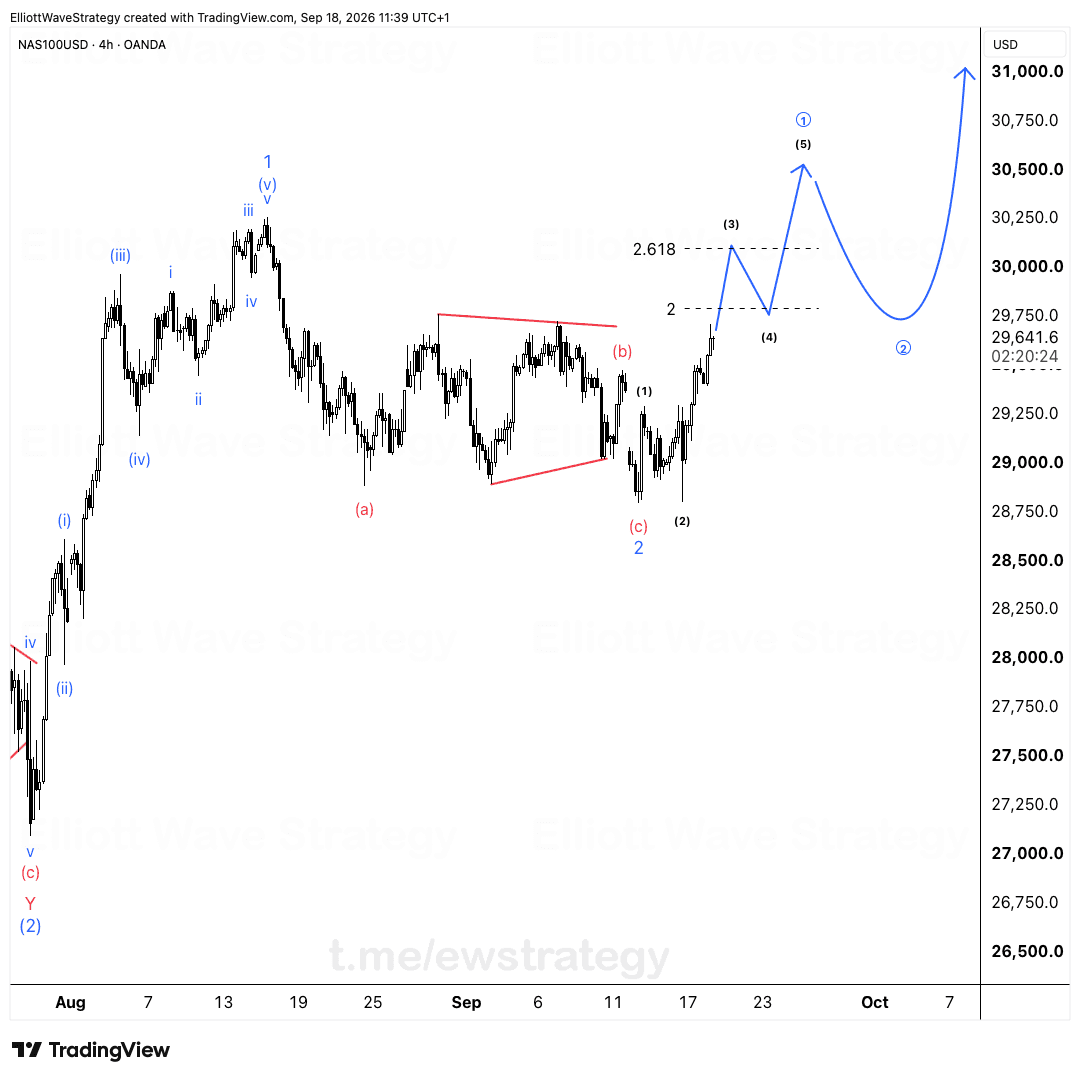
US100 🇺🇸 - (https://s3.tradingview.com/snapshots/k/K4EkutZC.png)
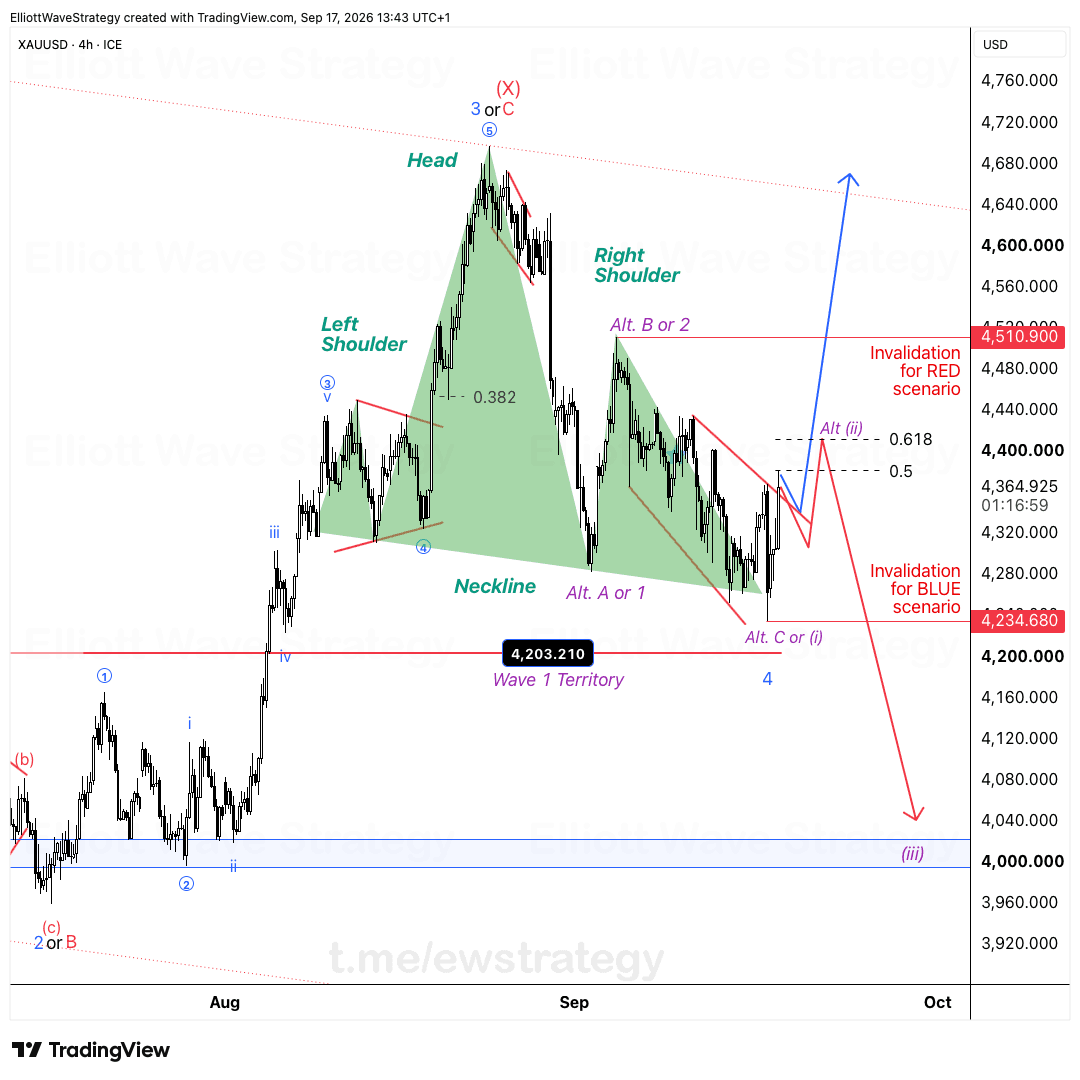
Blue or Red? Gold bounced right where we flagged it in our last update. A bounce alone doesn't tell you what's next though, just that the ma...
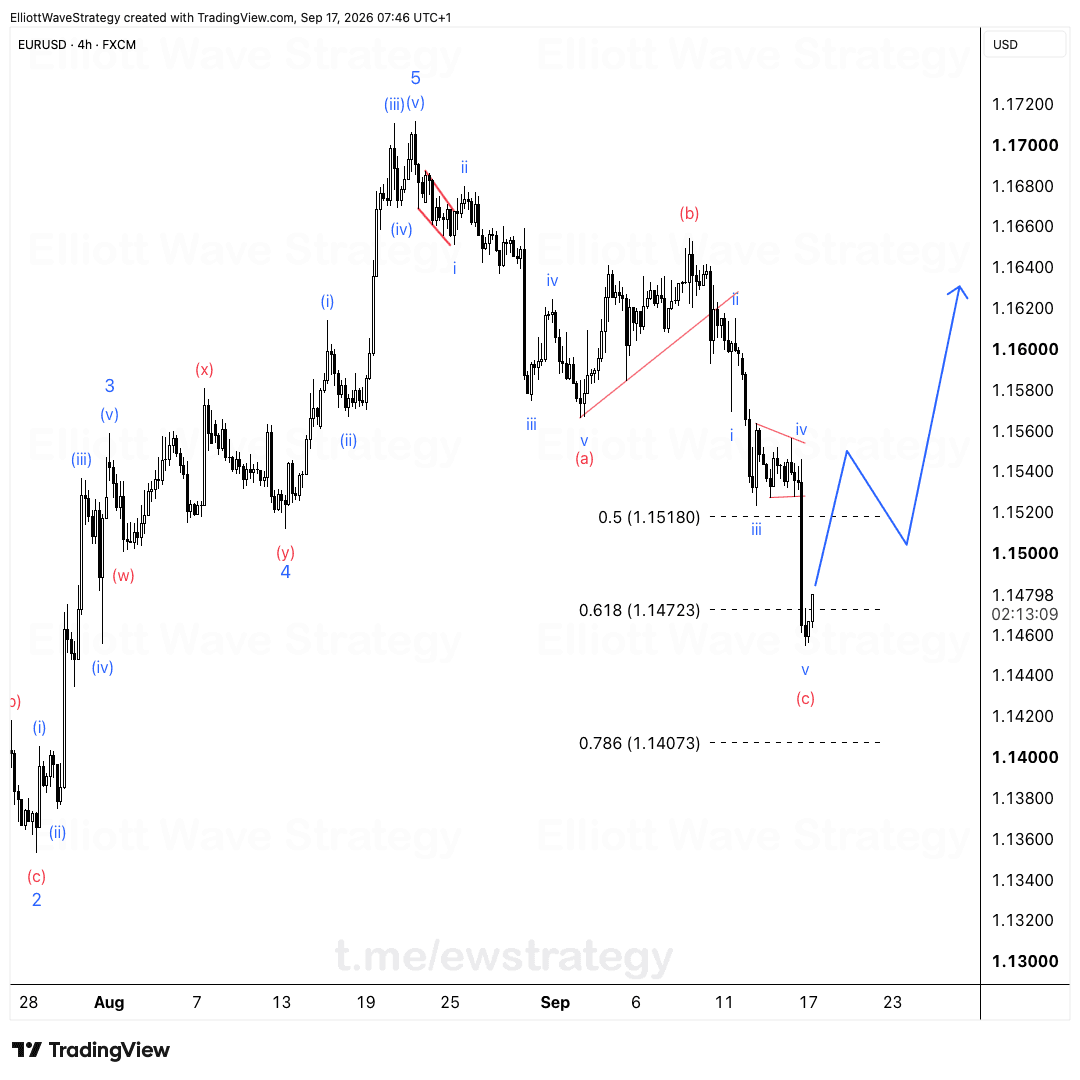
Bounce or reversal? The structure has an answer.
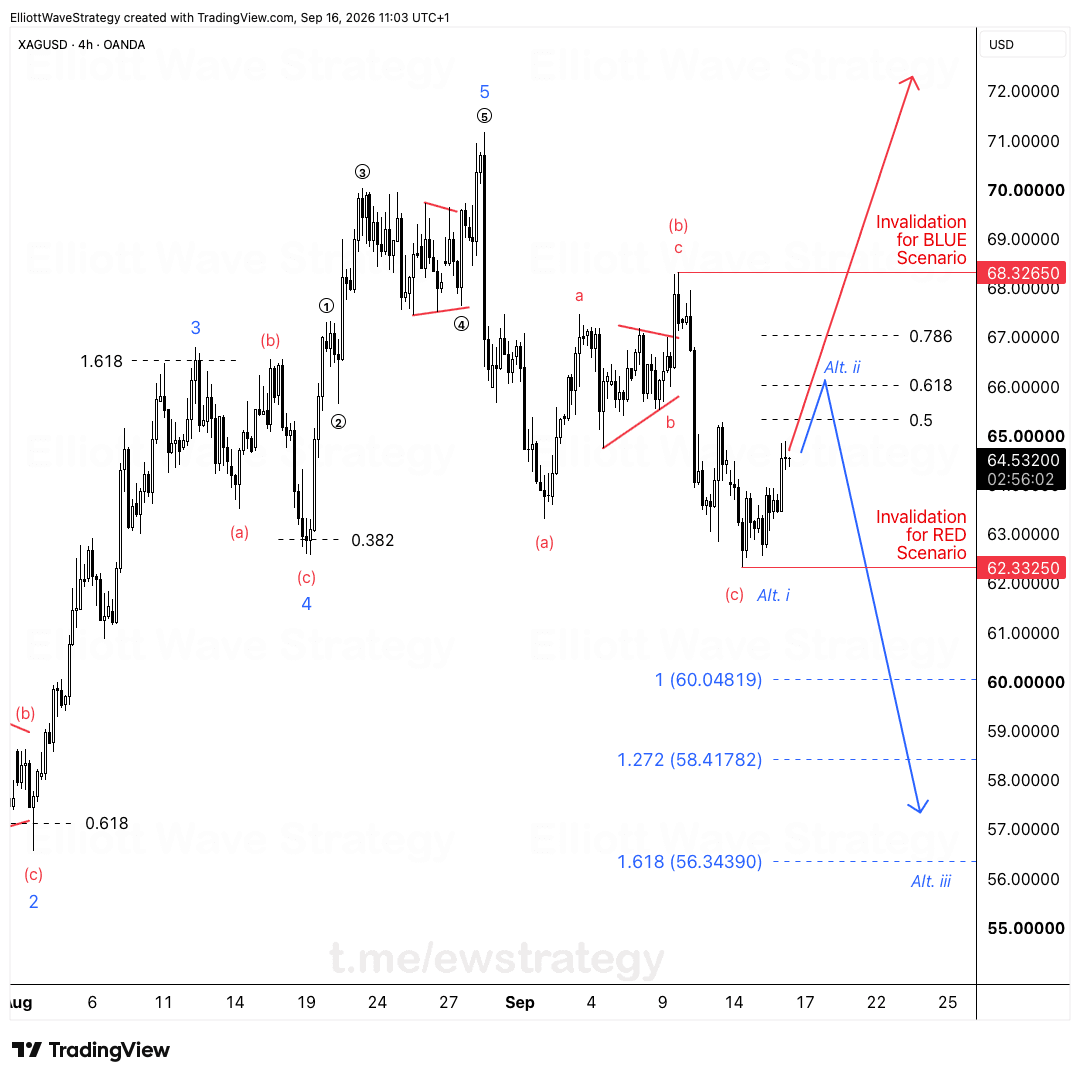
Chart: https://s3.tradingview.com/snapshots/p/PWNOAGRu.png
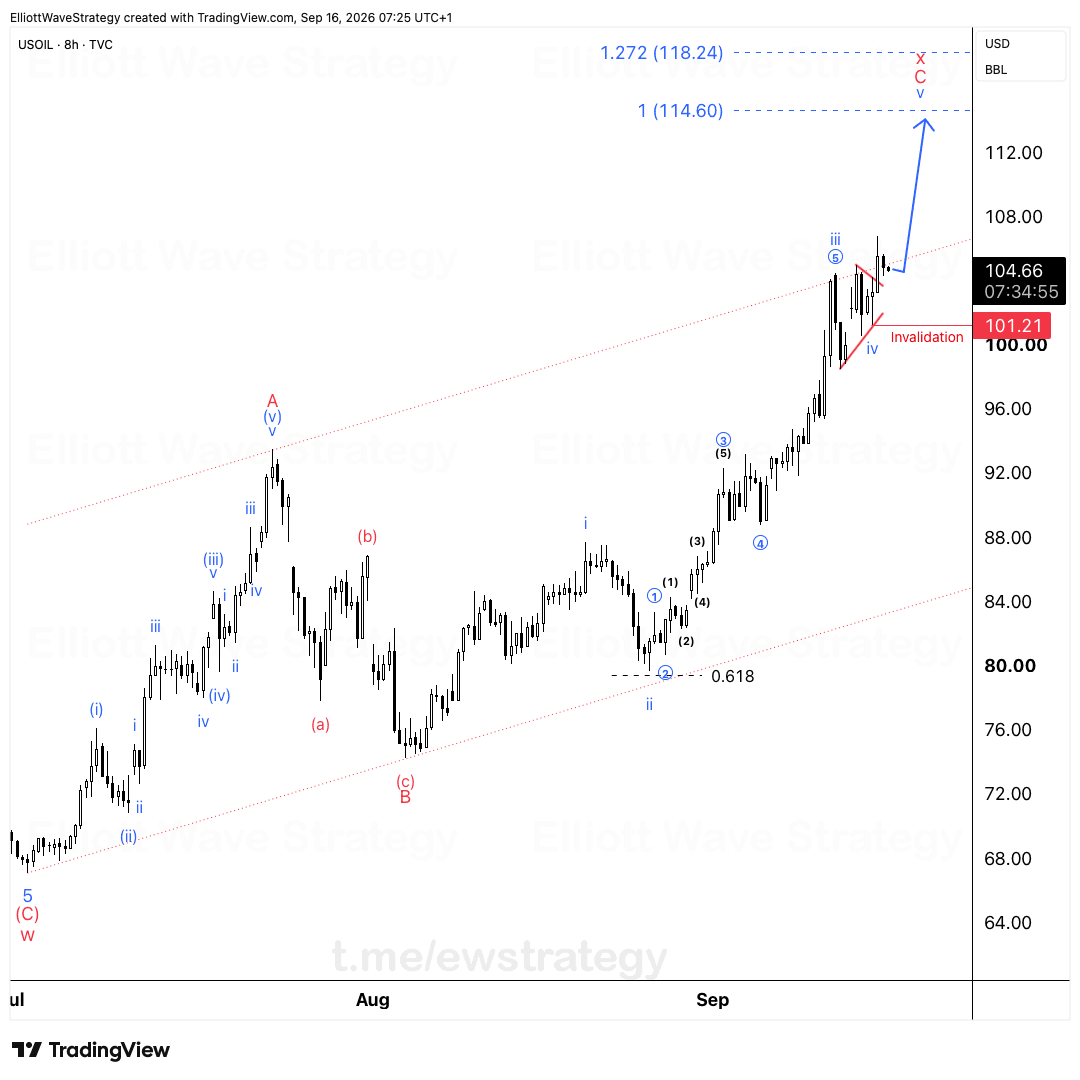
One more push for oil?
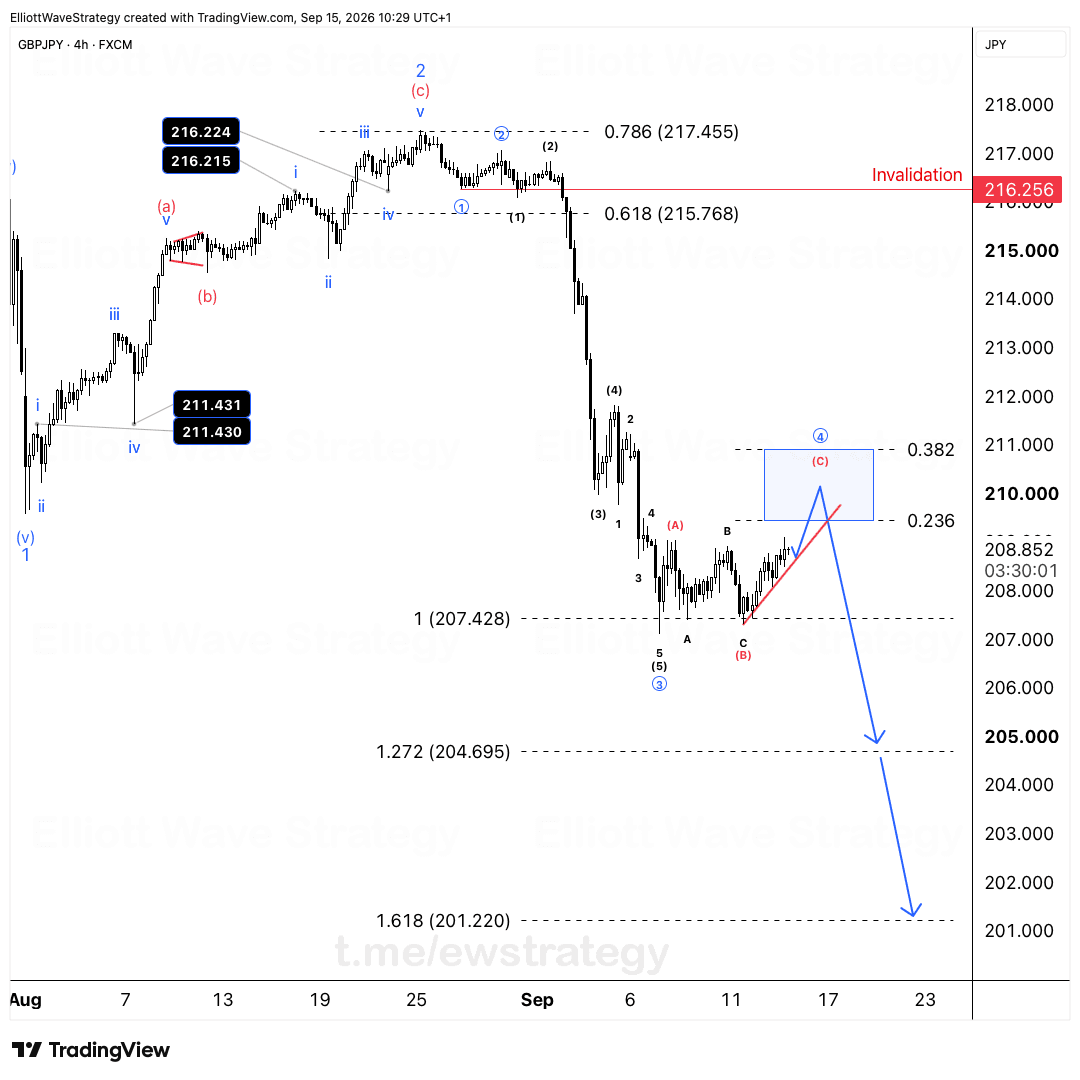
On September 3rd, we mapped further downside. Price hit 207.428, right where we expected. On September 8th, we flagged a corrective bounce b...
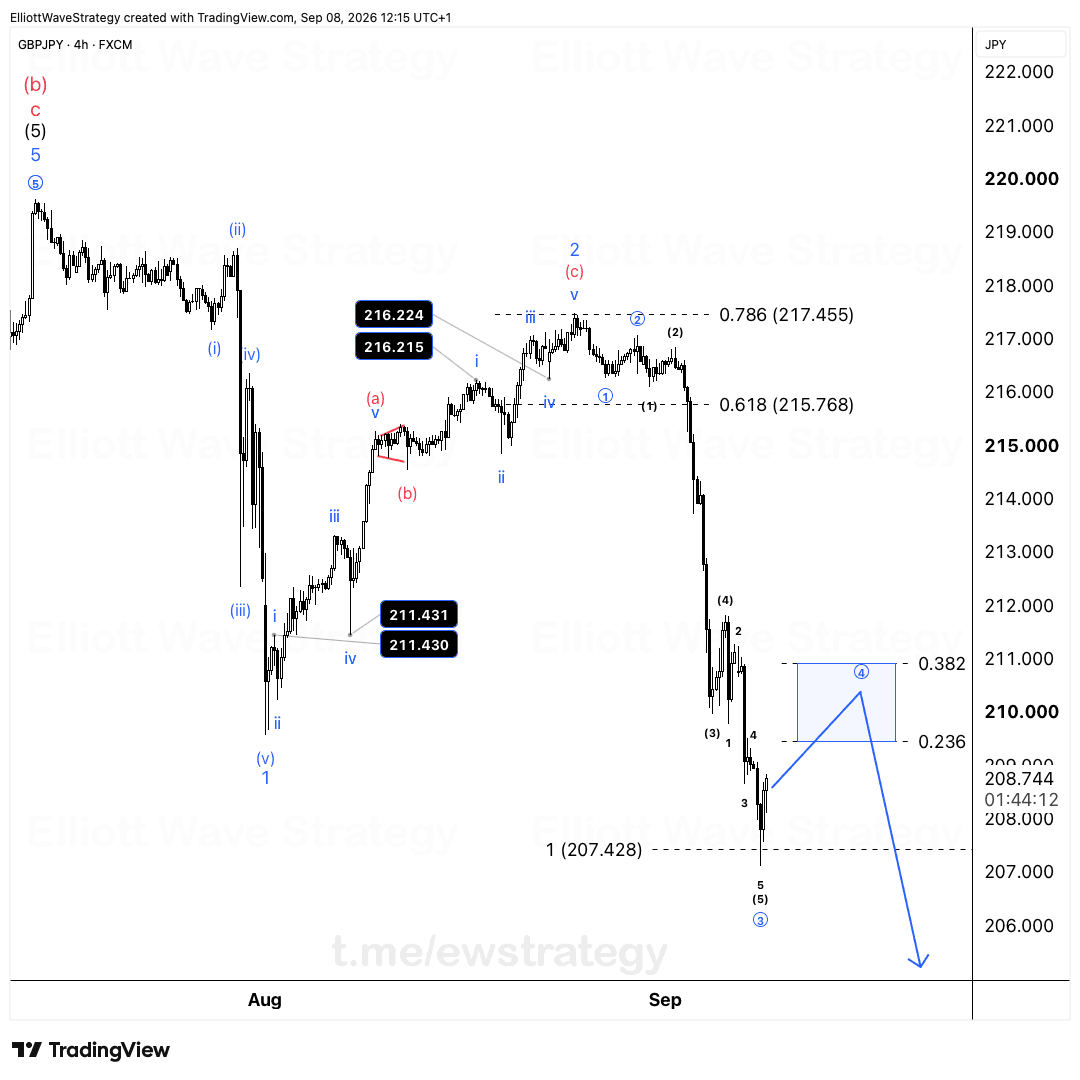
Wave 3 of (5) is done. Wave 4 is building now.
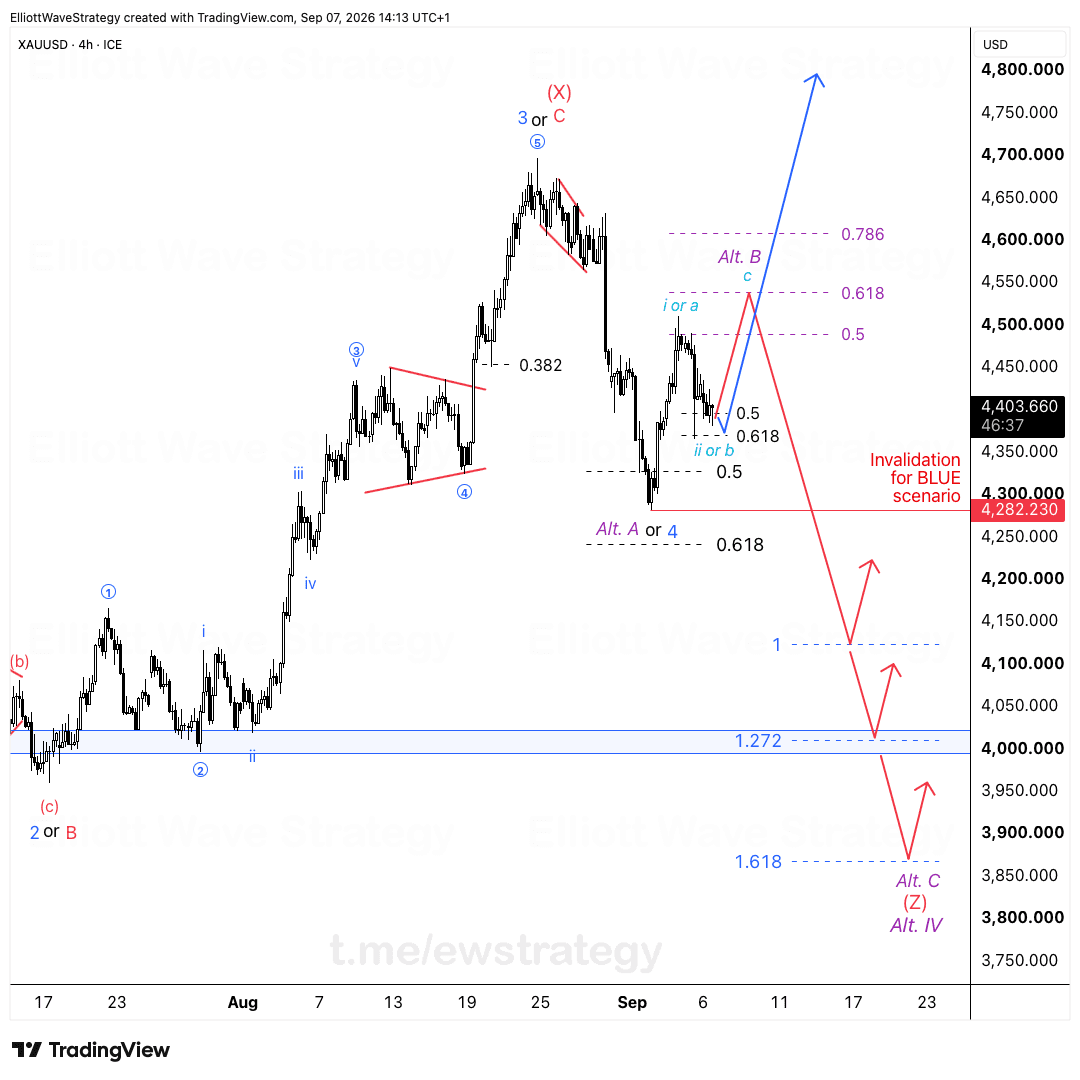
You don't have to predict the market. Nobody knows where gold goes next. Not us, not anyone. And that's fine.
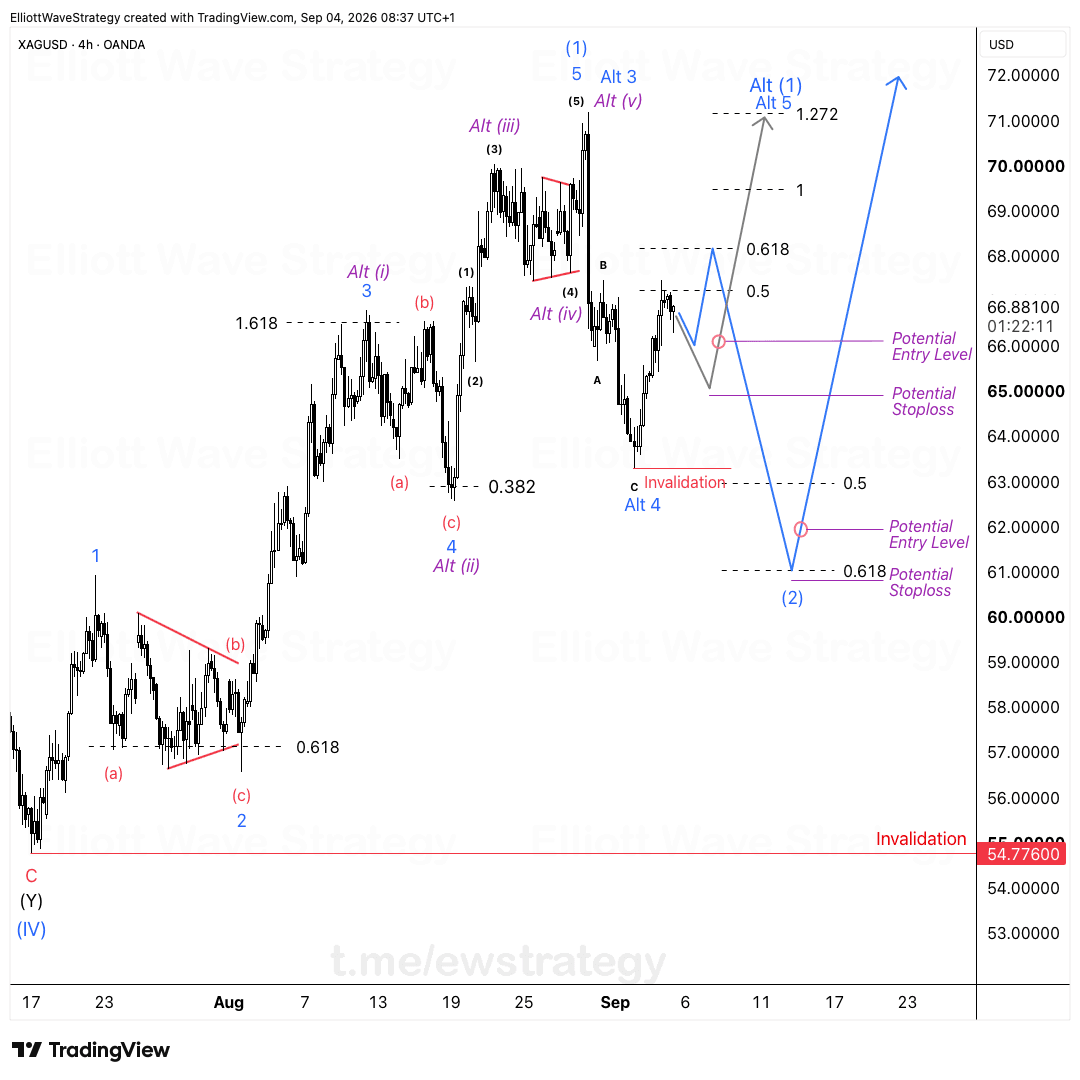
You don't need to be right every time. You need to know what to do when you're wrong.
Premium members get daily wave counts, entry zones, targets and invalidation levels for all 27 instruments.
See Premium PlansDated snapshots of real Elliott Wave counts published by EW Strategy: wave labels, Fibonacci levels and the invalidation line on the actual chart, exactly as members receive them.
Regularly, across forex, gold, crypto and indices. Members receive daily updated counts for 27 instruments; the free charts are a rotating sample of that coverage.
The invalidation line is the price level where the published wave count stops being valid. If price crosses it, the count is invalidated and the analysis is updated with a new structure.